WeatherWidget Manual
Complete reference for every setting and configuration option available in WeatherWidget — the compact desktop weather overlay for Windows and Linux.
Overview
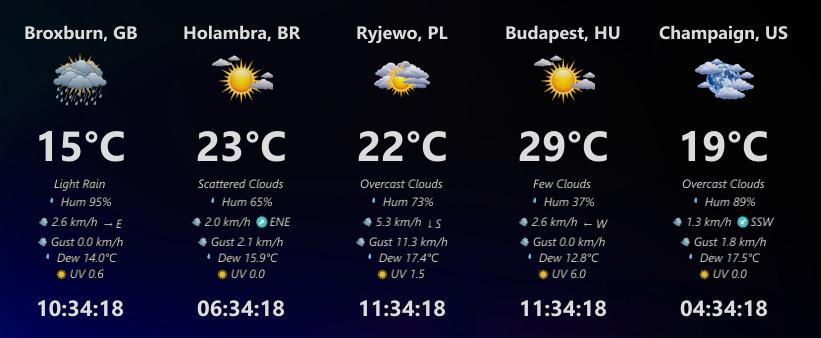
WeatherWidget is a compact, native desktop weather utility built in Go. It floats as a transparent overlay on your desktop, showing real-time weather and local time for up to 5 cities simultaneously with Pro (or up to 3 cities on the Free tier). All configuration is managed through the built-in Settings UI, accessible from the system tray.
Appearance
Position, monitor, transparency, temperature unit, and startup behaviour.
Data Display
Selectable elements — choose exactly which weather and clock fields to show.
Data Provider
Weather data source, API key, refresh interval, and Pro API access.
Locations
Manage tracked cities — add, remove, and reorder up to 5 locations.
Language
Choose from 9 supported languages for the interface.
About
Version info, license, and application details.
System Tray
WeatherWidget runs in the system tray (notification area). Right-click the tray icon to access the context menu with the following options:
Installation
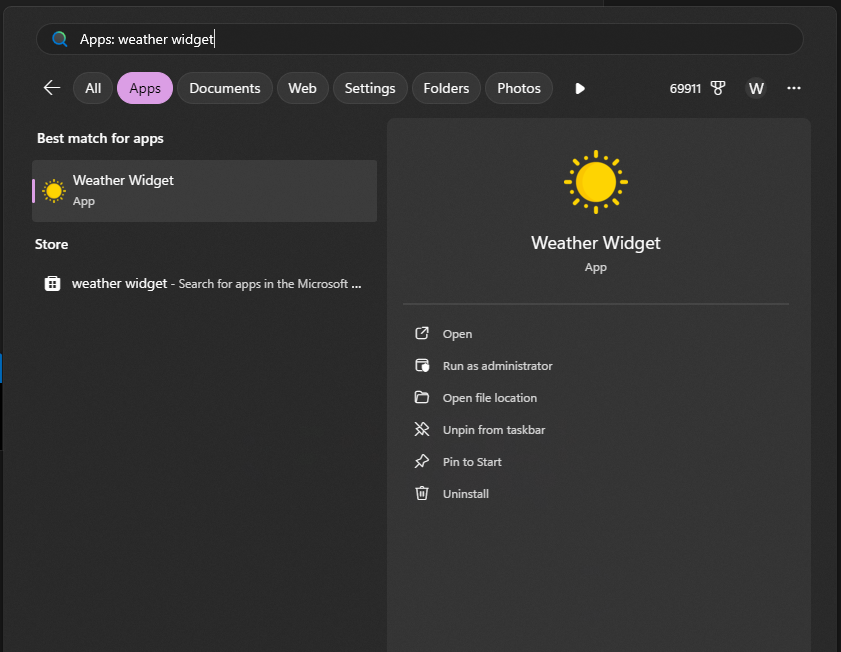
WeatherWidget is available through two distribution channels. Choose the one that fits your platform.
Snap Store (Ubuntu / Linux)
Install directly from the Snap Store. You can install via the Snap GUI or run sudo snap install weatherwidget.
Microsoft Store (Windows)
Download directly from the Microsoft Store. The app installs and updates automatically through the Store.
GitHub Releases (macOS, Linux ARM64 & Binaries)
Download pre-compiled binaries from the GitHub Releases page. Windows MSI installers and Linux/macOS binaries are provided.
Appearance Tab
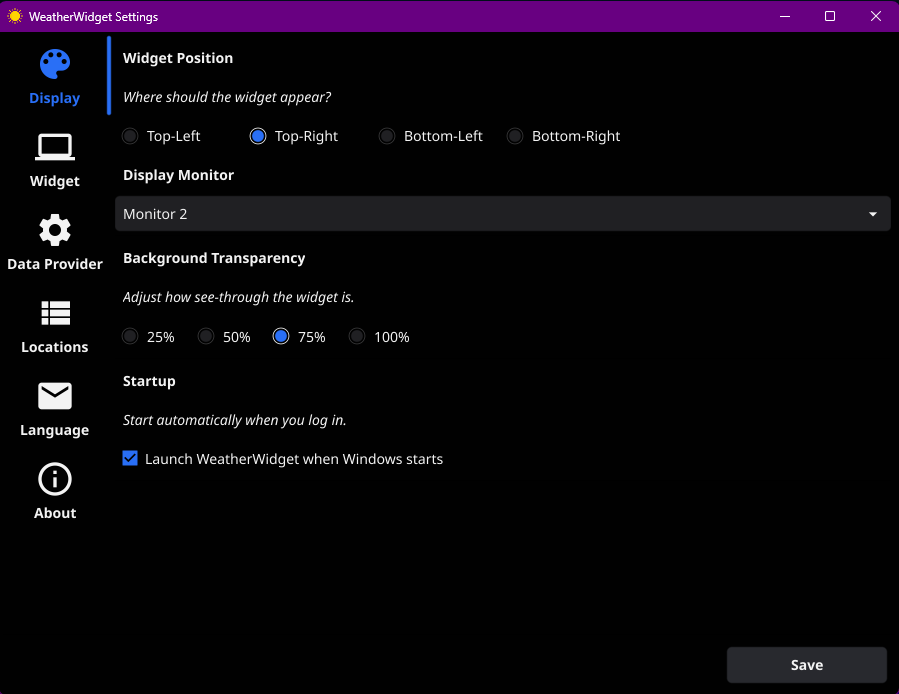
The Appearance tab controls how and where the weather widget is displayed on your desktop. Configure the widget's position, monitor selection, transparency, temperature unit, and startup behaviour.
| Setting | Options | Description |
|---|---|---|
| Widget Position | Top-Left · Top-Right · Bottom-Left · Bottom-Right | Determines which corner of the selected monitor the weather overlay will anchor to. The widget snaps to the chosen corner and remains fixed there. |
| Display Monitor | Monitor 1 · Monitor 2 · … | Selects which physical display the widget should appear on. If you have a multi-monitor setup, choose the monitor where you want the weather overlay to be visible. |
| Background Transparency | 25% · 50% · 75% · 100% | Adjusts the see-through level of the widget background. Lower values make the widget more transparent,
blending with your wallpaper. 100% is fully opaque. |
| Temperature Unit | °C (Celsius) · °F (Fahrenheit) | Sets the temperature measurement unit displayed for all tracked cities. |
| Startup | Checkbox | When enabled, WeatherWidget launches automatically when you log into Windows. The app starts minimised to the system tray. |
Data Display Panel Tab
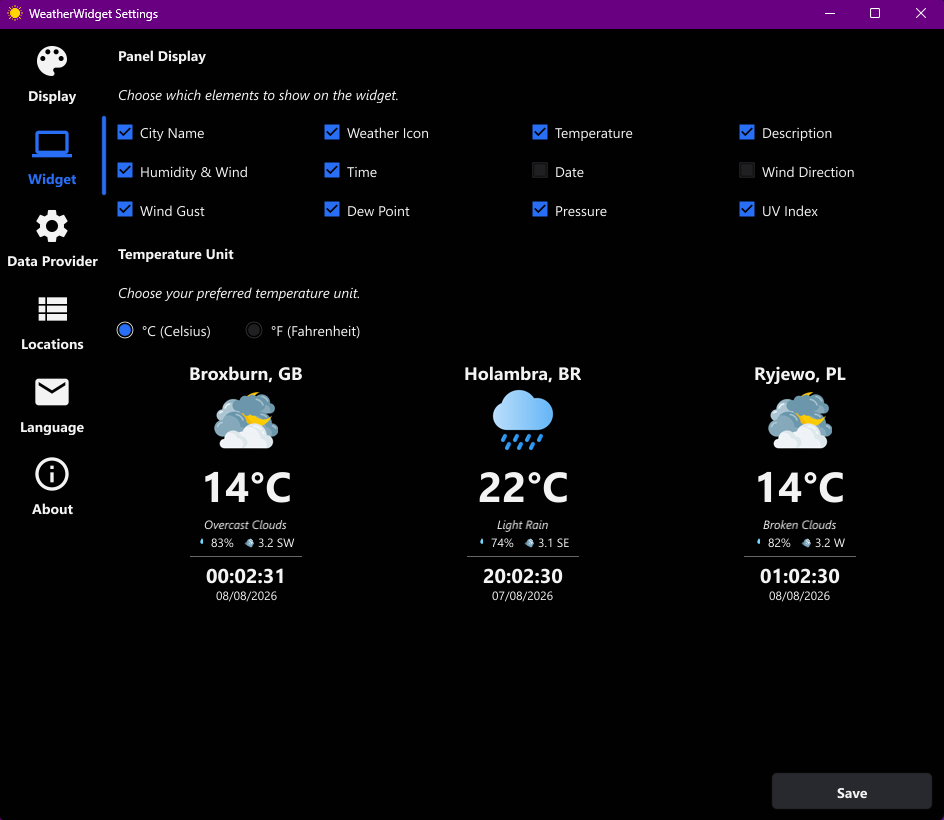
The Data Display settings tab allows you to customize the overlay panel layout. Toggle individual data fields on or off to choose exactly which weather metrics, atmospheric conditions, and real-time clock elements are visible on your desktop.
| Selectable Element | Type | Description |
|---|---|---|
| City Name | Text | Header displaying the city and country/region identifier for each tracked location. |
| Weather Icon | Icon | Visual condition icon (sun, rain, snow, clouds, thunder) reflecting live weather state. |
| Temperature | Numeric | Current temperature readout rendered in selected units (°C or °F). |
| Description | Text | Descriptive text summary of current atmospheric conditions (e.g., Clear Sky, Scattered Clouds). |
| Humidity & Wind Speed | Metrics | Combined display of relative humidity percentage and current wind speed. |
| Time | Clock | Real-time clock displaying the exact local time for each tracked city's timezone. |
| Date | Date | Calendar date formatted according to the selected locale settings. |
| Wind Direction | Compass | Wind direction compass heading indicator and cardinal degree readout. |
| Wind Gust | Metric | Peak wind gust speed measurements when available from the data provider. |
| Dew Point | Temperature | Atmospheric dew point temperature calculation. |
| Pressure | Barometric | Barometric atmospheric pressure reading (hPa / mbar). |
| UV Index | Numeric Index | Ultra-violet radiation index rating on a standard 0–11+ solar exposure scale. |
Data Provider Tab
Configure your weather data source, enter your API credentials, and set how frequently the widget refreshes meteorological data. Selecting and saving a valid provider in this tab is also what unlocks city editing in the Locations tab.
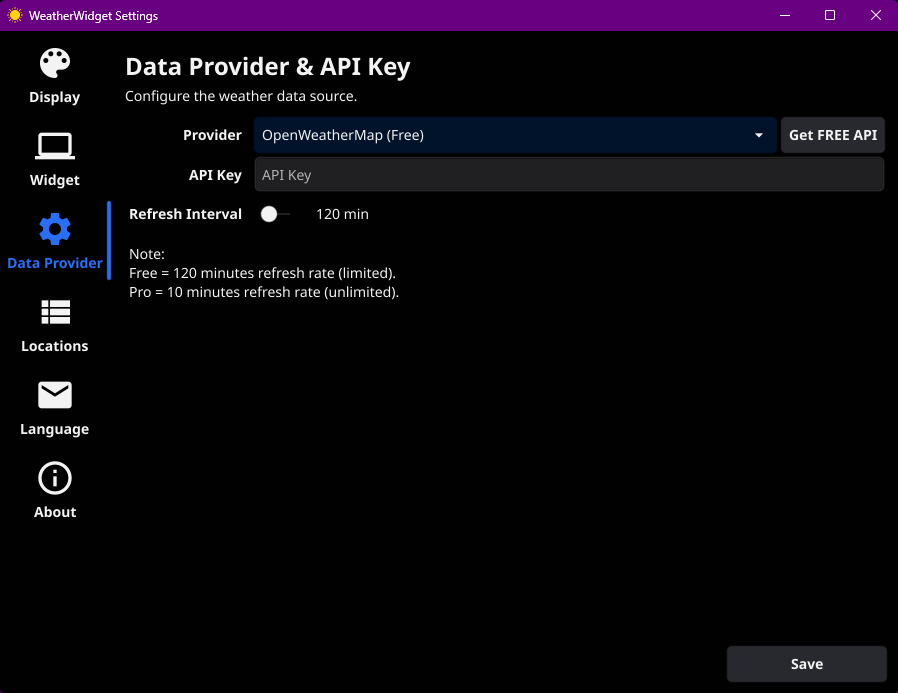
Available Provider Modes
EasyWeatherWidget (Pro)
Our fully integrated provider — no third-party accounts, developer portals, or manual API keys needed. It is a low-cost subscription that gives you worldwide weather coverage, regular data source enhancements, a fast 10-minute refresh rate, support for up to 5 simultaneous cities, priority customer support, and monthly update newsletters.
OpenWeatherMap (Free)
If you prefer the free option, you can create a free account at openweathermap.org,
generate a free API key, and paste it into the API Key field in the app. After clicking Save,
the Locations tab will unlock and you’ll be able to add or edit up to 3 preferred cities with a standard 120-minute refresh rate.
Pro vs Free Comparison
| Feature | OpenWeatherMap (Free) | EasyWeatherWidget (Pro) |
|---|---|---|
| Max Tracked Cities | Up to 3 cities | Up to 5 cities |
| Refresh Interval | 120 minutes (standard) | 10 minutes (rapid live updates) |
| Account & Setup | Requires creating external account & manual API key | Zero configuration — fully integrated |
| Data Sources & Coverage | Standard OpenWeatherMap API coverage | Worldwide coverage with ongoing data source additions |
| Support & Updates | Standard community support | Priority support & monthly update newsletters |
| Pricing | Free (uses your personal free key) | Low-cost subscription (with Lifetime early adopter promo) |
Data Provider Settings Reference
| Setting | Options | Description |
|---|---|---|
| Provider | EasyWeatherWidget (Pro) · OpenWeatherMap (Free) | Select your weather data provider. Pro uses the built-in EasyWeatherWidget service (up to 5 cities, 10-min refresh). Free uses OpenWeatherMap with your API key (up to 3 cities, 120-min refresh). |
| API Key | string | Required when using OpenWeatherMap. Paste the API key generated from openweathermap.org. For Pro subscribers, the key is provisioned automatically upon subscription. |
| Refresh Interval | minutes | How frequently the widget fetches new weather data. Free tier: 120 minutes. Pro tier: 10 minutes. |
Locations Tab
Manage the cities you want to track. You can track up to 5 cities with Pro (or up to 3 cities on the Free tier) and reorder them to control the display sequence on the weather overlay. Each city entry includes name, region, coordinates, and timezone.
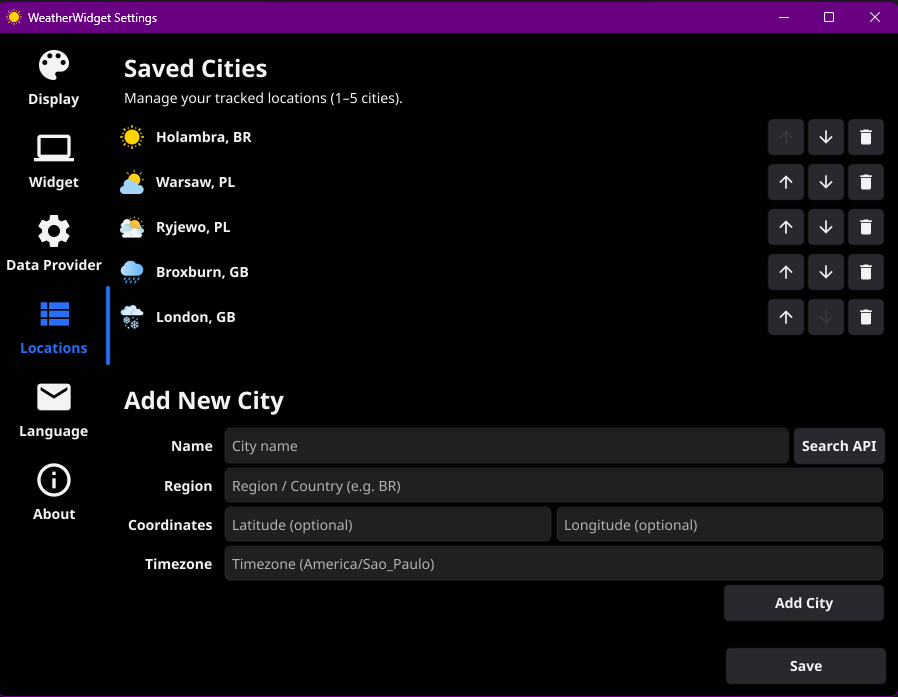
Saved Cities
The saved cities list shows all currently tracked locations. Each entry displays its position number, city name, and region code. Use the ↑ ↓ arrows to reorder cities and the Remove button to delete a city from the list.
Add New City
| Field | Type | Status | Description |
|---|---|---|---|
| Name | string | Required | The city name to display (e.g. London, Warsaw). Use the Search
API button to auto-fill coordinates. |
| Region | string | Required | Country or region code (e.g. GB, BR, PL). Used alongside the
city name for disambiguation. |
| Latitude | float | Optional | Geographic latitude coordinate. Auto-filled when using the Search API feature, or enter manually for precision. |
| Longitude | float | Optional | Geographic longitude coordinate. Auto-filled when using the Search API feature, or enter manually for precision. |
| Timezone | string | Required | IANA timezone identifier (e.g. America/Sao_Paulo, Europe/London). Used to
display the correct local time for each city. |
Language Tab
Choose your preferred interface language. WeatherWidget supports 9 languages. The selected language affects all labels, descriptions, and weather condition text displayed in the widget and settings window.
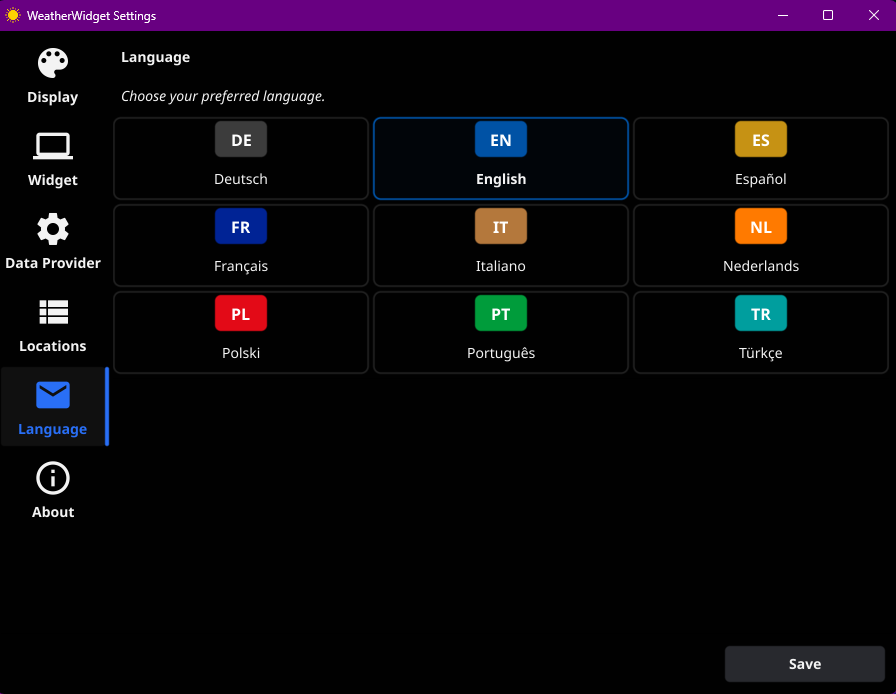
| Code | Language |
|---|---|
| DE | Deutsch (German) |
| EN | English |
| ES | Español (Spanish) |
| FR | Français (French) |
| IT | Italiano (Italian) |
| NL | Nederlands (Dutch) |
| PL | Polski (Polish) |
| PT | Português (Portuguese) |
| TR | Türkçe (Turkish) |
About Tab
The About tab displays application version information, license details, and links to the project resources. Use this tab to verify which version you are running and access support channels.
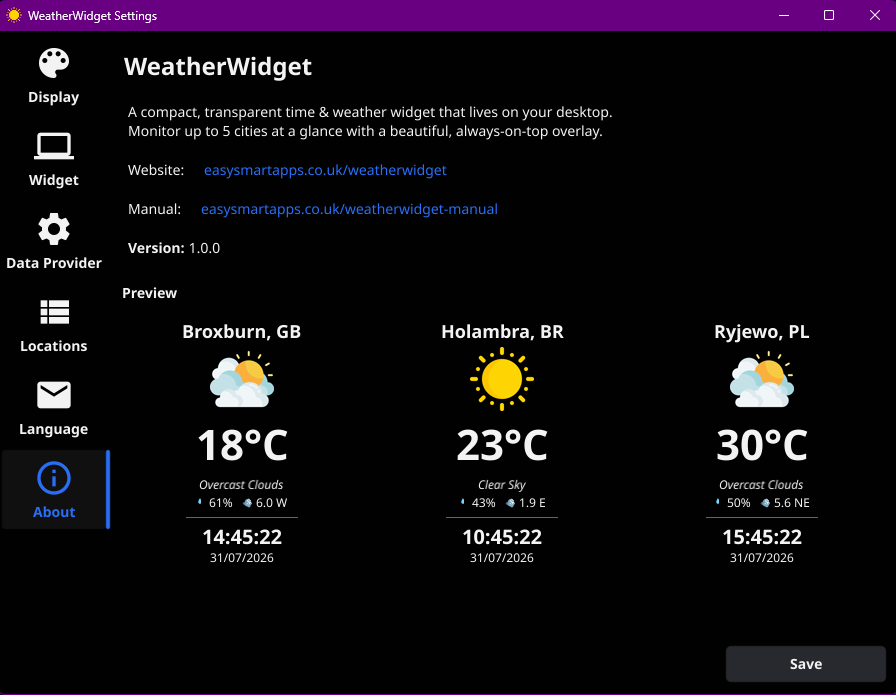
Shows the current application version number and build details. Useful when reporting issues or checking for updates.
Displays the application license type. WeatherWidget is shared under AGPL-3.0 with Commons Clause and Trademark Protections.
Direct links to the GitHub repository, issue tracker, and the Easy Smart Apps website for additional resources.
Config File Location
All configuration is stored locally in a single JSON file. No cloud dependencies — your data stays on your machine.
Windows
Linux
%APPDATA% resolves to
C:\Users\<YourUsername>\AppData\Roaming. You can type %APPDATA% directly
into Windows Explorer's address bar to navigate there.
JSON Configuration Reference
The configuration file contains all widget settings. While it's recommended to use the Settings UI, advanced users can edit this file directly.
| Field | Type | Description |
|---|---|---|
| dataSource | string | The data source mode. Typically "remote_api" for live weather data. |
| cities | object[] | Array of city objects (1–3 entries on Free, 1–5 entries on Pro). Each city has name, region,
latitude, longitude, and timezone.
|
| refreshInterval | int | Weather data refresh interval in minutes. Free: 120 min. Pro: as low as 10 min. |
| cornerPosition | string | Widget anchor position. One of: "top-left", "top-right",
"bottom-left", "bottom-right".
|
| monitorIndex | int | 0-indexed display monitor number. 0 = primary monitor. |
| opacity | int | Background opacity percentage. Valid values: 25, 50, 75,
100.
|
| locale | string | Interface language locale code (e.g. "en-GB", "pt-BR",
"de-DE").
|
| apiConfig.provider | string | Weather API provider. "openweathermap" (free) or "easyweatherwidget" (pro).
|
| apiConfig.apiKey | string | Your API key for the selected provider. |
{
  "dataSource": "remote_api",
  "cities": [
    {
      "name": "Holambra",
      "region": "BR",
      "latitude": -22.6332,
      "longitude": -47.0545,
      "timezone": "America/Sao_Paulo"
    },
    {
      "name": "Edinburgh",
      "region": "UK",
      "latitude": 55.95,
      "longitude": -3.19,
      "timezone": "Europe/London"
    },
    {
      "name": "Warsaw",
      "region": "PL",
      "latitude": 52.231958,
      "longitude": 21.006725,
      "timezone": "Europe/Warsaw"
    }
  ],
  "refreshInterval": 10,
  "cornerPosition": "top-right",
  "monitorIndex": 0,
  "opacity": 25,
  "locale": "en-GB",
  "apiConfig": {
    "provider": "openweathermap",
    "apiKey": "YOUR_API_KEY"
  }
}
Troubleshooting
Common issues and their solutions.
Location Editing is Locked / Grayed Out
The grayed-out locations area is expected behavior when launching the app for the first time or before saving a provider. The application requires a valid, saved weather provider before allowing cities to be added or edited.
How to unlock location editing:
Open the Data Provider Tab
In the Settings window, click on the Data Provider tab.
Choose Your Provider
Option 1 — EasyWeatherWidget (Pro): Fully integrated with zero external accounts or manual API keys needed.
Provides worldwide coverage, regular updates, a fast 10-minute refresh rate, up to 5 tracked cities, priority support, and monthly newsletters.
Option 2 — OpenWeatherMap (Free): Create a free account at openweathermap.org,
generate an API key, and paste it into the API Key field (supports up to 3 cities with a standard 120-minute refresh rate).
Click Save
Click the Save button. The Locations tab will unlock immediately, and you can add, edit, or reorder your tracked places.
OpenGL Driver Issue
If the app appears in the system tray but clicking Settings or Show Widget does nothing, the application may have failed to create the UI window due to missing OpenGL drivers.
Diagnosis: Run the application from the command line with the
-debug flag:
Then check the log file:
Fix: Install Graphics Drivers or Mesa3D
This occurs on clean Windows installations or virtual machines lacking proper OpenGL 2.0+ support.
Install Graphics Drivers
Install the proper Intel, AMD, or NVIDIA graphics drivers for your system.
Alternative: Mesa3D Software Renderer
Download a pre-compiled Mesa3D for Windows package. Extract the 64-bit
opengl32.dll and place it in the same folder as weatherwidget.exe.
-software flag is also available (.\weatherwidget.exe -software) which
instructs the Fyne framework to prefer software rendering, but this still requires basic OpenGL driver
availability at the OS level.Quick Reference
At-a-glance summary of key values and limits.